
JOBLESSNESS AMONG DOMESTIC WORKER RESPONDENTS DECREASED TO 15% IN MARCH
THE WAGE DISTRIBUTION CONTINUED TO IMPROVE DURING THE FIRST QUARTER OF 2024
Domestic Workers Economic Situation Report · March 2024
With analysis from the first quarter of 2024
Source: La Alianza surveys, NDWA
Released: April 10, 2024
The most recent Bureau of Labor Statistics (BLS) Employment Situation Report shows job growth above market expectation in March, and the general unemployment rate ticked down. [1]
NDWA’s March data shows a decrease to 15% in joblessness for surveyed domestic workers. Joblessness has decreased for four consecutive months. While this is within the lower end of joblessness rates we have seen since the pandemic began, it remains over the rate of 9% who reported having no jobs before COVID-19. [2]
Domestic workers are the nannies, homecare workers, and house cleaners whose work is essential to our economy, yet they are some of the most vulnerable and marginalized workers. They work in private homes and often have multiple employers, meaning they may have to schedule several jobs to make ends meet. Domestic workers earn less than the average US worker and are three times as likely to be living in poverty. [3]
La Alianza survey data from Spanish-speaking domestic workers shows how respondents continue to face low wages and high levels of unemployment and underemployment.
March Jobs Report - Bureau of Labor Statistics
The BLS releases an Employment Situation Summary with employment and other labor market data each month. It’s an important report to keep track of how the economy is doing. However, domestic workers and other vulnerable workers are underrepresented in official data. [4] Here, we present an overview of the BLS Jobs report along with NDWA’s data, which shows the employment and economic situation of thousands of Spanish-speaking domestic workers.
On April 5, the BLS released new employment data for March 2024.
The number of jobs added was above market expectations.
The general unemployment rate ticked down.
The unemployment rate for Latina women decreased.
The unemployment rate for Black women increased.
The unemployment rates for Black and Latinx adults continue to be higher compared to the rates for white adults.
Average hourly earnings for employees in private nonfarm payrolls increased.
Similarly, NDWA’s March data shows a decrease in joblessness for surveyed Spanish-speaking domestic workers. While the share of joblessness for domestic workers is not directly comparable to the unemployment rate nationwide,* looking at trends in the data for Spanish-speaking domestic workers in the context of national trends can support our understanding of the sector as it relates to the broader economy.
March Domestic Worker Economic Situation
Below are the main findings on the economic situation of surveyed Spanish-speaking domestic workers in March. Note that monthly numbers may be volatile, which is why we look at the findings as they relate to prior trends in the data and the economic situation of the overall economy. At the end of each quarter, we calculate quarterly averages for key economic indicators.
Jobs and Wages
Joblessness increased slightly from 18% to 19% on average in the first quarter of 2024.
This increase follows several consecutive quarterly increases in joblessness over the past year.
However, month-to-month joblessness decreased, with a drop from 19% in February to 15% in March.

Underemployment increased to 67% on average in the first quarter, from 60% on average in the prior quarter.
The main reason for underemployment that workers reported in the first quarter was that they could not find more clients (61%), followed by having a health problem (14%) and taking care of a family member (14%), while 11% chose some “other” reason.
Underemployment had remained steady over the past year, ranging between a quarterly average of 60% and 61%.
Month-to-month underemployment decreased from 74% in February to 65% in March.
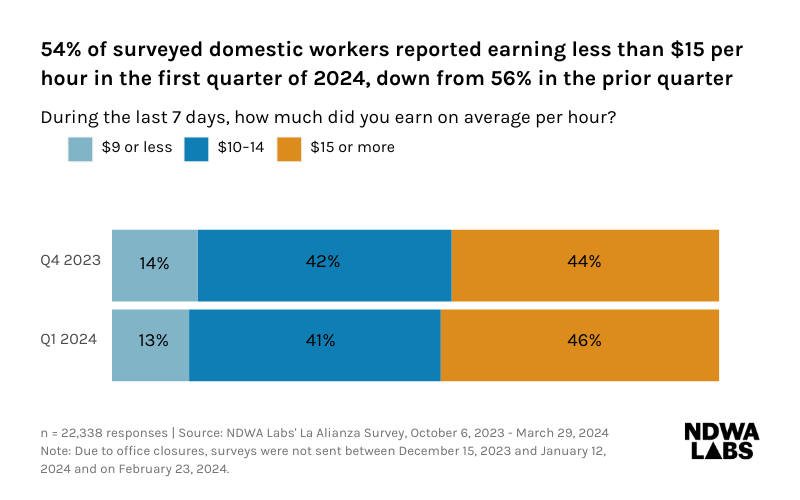
The wage distribution improved during the first quarter of 2024, with fewer respondents reporting earning less than $15 per hour.
54% of domestic worker respondents reported earning less than $15 per hour on average this quarter, compared to 56% during the last quarter of 2023.
This follows a consistent improvement in the wage distribution over the past year.
In March, 52% of respondents reported earning less than $15 per hour on average, a decrease from 56% in February.
Economic Security
In the first quarter of 2024, food scarcity increased slightly to 83%.
Respondents said they either often (14%) or sometimes (69%) faced food scarcity the week before being surveyed.
Food scarcity has worsened slightly each quarter over the past year.
Food scarcity in March increased to 84% from 82% in February.
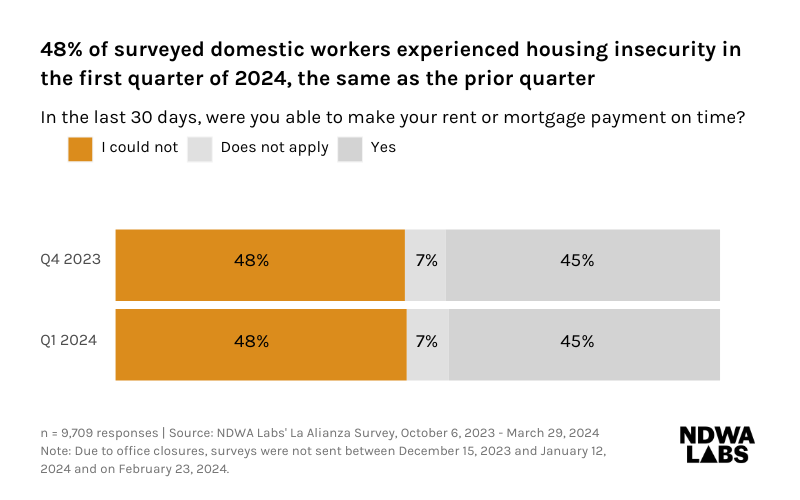
Surveyed domestic workers’ housing insecurity remained steady in the first quarter of 2024 at 48%.
7% percent of respondents on average reported that the question regarding the ability to afford rent or mortgage does not apply to them. This does not necessarily mean they are housing secure. While some of these respondents may be debt-free homeowners, others may be temporarily staying with friends or family, staying in shelters, or facing homelessness.
Housing insecurity in March increased to 53% from 44% in February.
The share of domestic worker respondents who struggled to afford regular household expenses remained steady in the first quarter of 2024.
On average this quarter, 55% of respondents reported it was very or somewhat difficult to afford regular household expenses - such as food, housing, car payments, and medical expenses.
Domestic worker respondents experienced varying levels of difficulty affording these expenses: 6% reported no difficulty, 39% reported little difficulty, 30% reported some difficulty, and 26% reported large difficulty.
In March, the share of respondents who reported some or large difficulty affording regular expenses increased to 58% from 53% in February.
About the surveys
NDWA surveys Spanish-speaking domestic workers via La Alianza, a Messenger chatbot. Starting in 2024, the survey has been sent every other week excluding office closures. At the end of each survey, La Alianza provides respondents with relevant news articles and resources in Spanish. To learn more about NDWA’s La Alianza survey of Spanish-speaking domestic workers, see the methodology section of this report.
In September 2023, the survey sample was expanded to increase the volume of responses and address survey fatigue. We learned that respondents newly added to the survey schedule reported lower joblessness on average than prior respondents. We updated the rotation groups in 2024 to reduce monthly volatility.
The numbers presented in this report include data from 6 biweekly surveys in the first quarter of 2024. The total number of fully completed surveys, which includes both new and repeated respondents, was 11,270. Please see the table below for greater detail on completions broken down by month.
| Month | Number of weekly surveys | Total completed surveys |
|---|---|---|
| March | 2 | 2,895 |
| February | 2 | 4,458 |
| January | 2 | 3,917 |
Questions about hours worked and hourly wages are asked biweekly, and questions regarding underemployment, job search, and economic security are asked monthly.
For questions or feedback, please contact us here.
Notes
1 White House Council of Economic Advisers (2024), The Employment Situation in March 2024: Rinse and repeat! A Virtuous Cycle in the Job Market
2 NDWA Labs (2020), 6 Months in Crisis: The Impact of COVID-19 on Domestic Workers
3 Economic Policy Institute (2022), Domestic Workers Chartbook
4 Kopparam (2022), What federal statistical agencies can do to improve survey response rates among Hispanic communities in the United States
* Unlike unemployment rates, joblessness for domestic workers may include people who are not working but are currently unavailable to work, or not actively looking for jobs. Additionally, the NDWA’s joblessness rate for surveyed domestic workers is not seasonally adjusted, while BLS unemployment rates are adjusted.