
La Alianza Domestic Worker Surveys - Quarterly Report
DOMESTIC WORKER SURVEY POINTS TO LOWER WAGES AND FEWER WORK HOURS IN Q2
August 2025
This report summarizes 2,889 responses to seven biweekly surveys conducted among Spanish-speaking domestic workers in the second quarter of 2025 (April-June). It explores key concerns related to basic needs, employment situation, job quality, psychological well-being, and worker voice.
ABOUT DOMESTIC WORK
Domestic workers are the nannies, house cleaners, and home care workers that make all other work possible. They care for our children, bring order to our homes, and ensure our loved ones receive the assistance they need to live with dignity and independence in their homes.
Despite their essential contributions to our economy, domestic workers are some of the most vulnerable and marginalized workers. They earn less than the average US worker and are three times as likely to be living in poverty, often relying on several jobs across multiple employers to make ends meet [1].
KEY SURVEY FINDINGS — Q2 2025
81% of respondents reported food scarcity at home for the second consecutive quarter.
Nearly half of all respondents (49%) missed rent or mortgage payments.
46% of respondents earned $14 or less per hour, compared to 44% earlier this year. Domestic worker respondents also reported fewer working hours compared to the first quarter of 2025 despite 63% of respondents expressing a desire for more work.
82% of domestic worker respondents expressed concern about their health and safety at work, and 34% reported experiencing unjust or disrespectful treatment.
Only 6% of respondents said they had a written contract that includes paid time off, and more than half felt very or somewhat uncomfortable asking for a sick day.
More than half of domestic worker respondents (51%) reported poor psychological well-being, according to the well-being score threshold suggested by the World Health Organization (WHO) [2]. This represents a significant increase from the 43% with reported poor psychological well-being in 2024.
When asked to describe their voice in the workplace, domestic worker respondents reported having less say than they believe they ought to have in almost all workplace issues. The largest voice gaps were in regards to wages and working conditions.
SURVEY FINDINGS
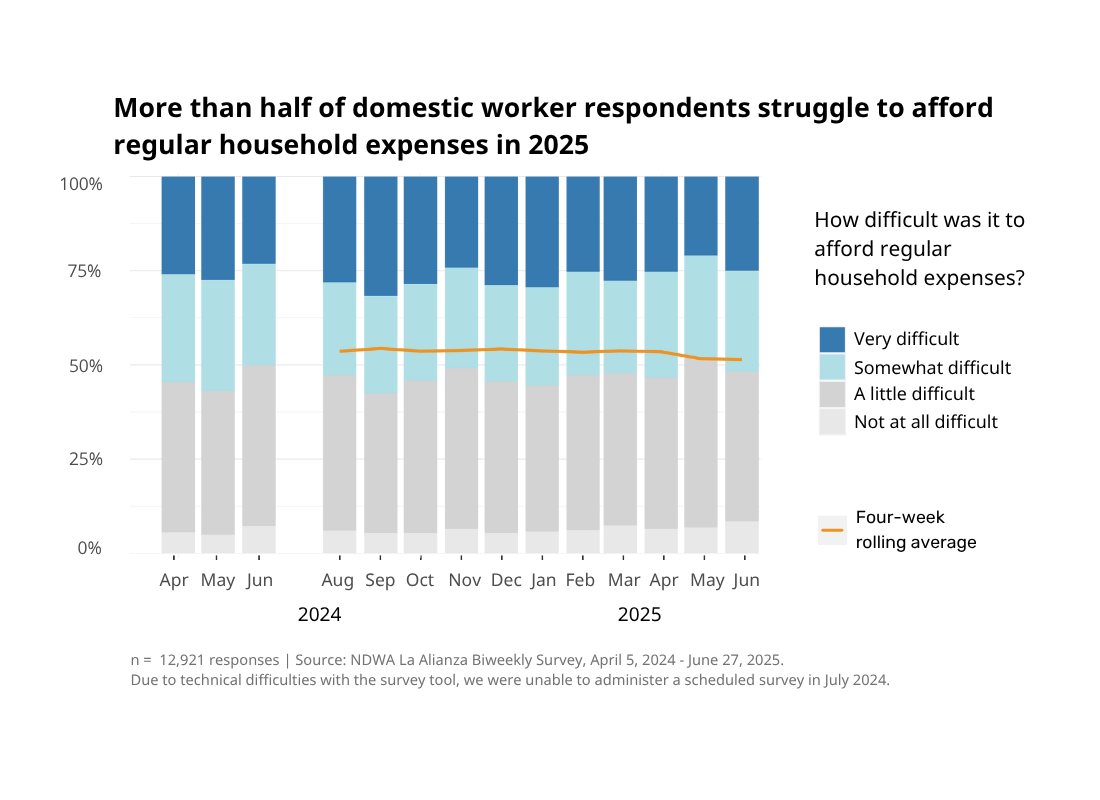
Basic Needs: Household Expenses
In the second quarter of 2025, 51% of domestic worker respondents found it either very or somewhat difficult to pay for regular household expenses, including food, rent, car payments, and medical expenses. This reflects an improvement from the 54% of respondents who reported similar difficulties in the first quarter of 2025.
As seen below, difficulty affording regular household expenses has been a consistent pattern for the past 15 months.
Housing
Nearly half of all respondents (49%) said they were unable to make timely rent or mortgage payments during the second quarter of 2025. This is only a slight decrease compared to the first quarter, when 50% of reported missing rent or mortgage payments.
Food Scarcity
Food scarcity, defined as not having enough food “often” or “sometimes,” was reported by 81% of respondents in both the first and second quarters of 2025. Although the share of domestic worker respondents experiencing food scarcity is still alarming, the share of respondents who reported insufficient food “often” was 2 percentage points lower in the second quarter, offset by a 2 percentage-point increase in those reporting insufficient food “sometimes”, suggesting a shift away from more severe food scarcity.

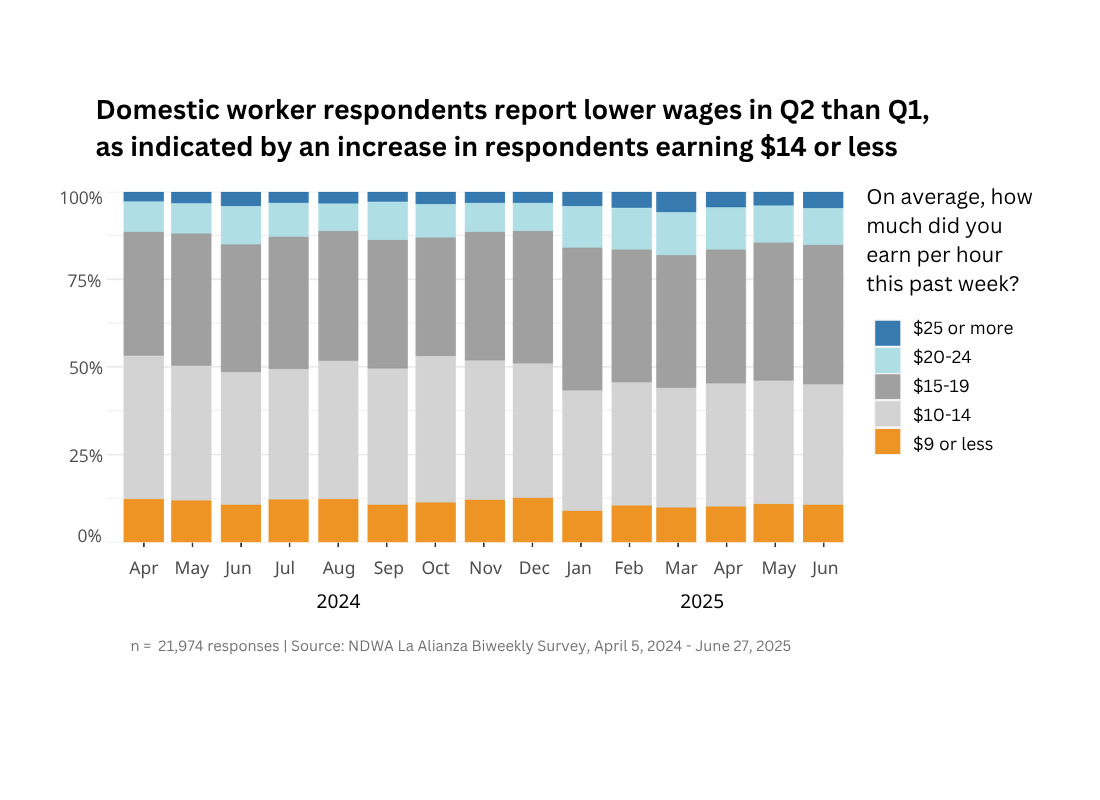
Employment Situation: Compensation
During the second quarter of 2025, 46% of respondents earned $14 or less per hour, compared to 44% in the first quarter. The share of respondents earning $9 or less rose by 1 percentage point, as those earning $20–$24 and $25 or more declined by 1 point each, indicating a shift toward lower wages in the second quarter of 2025.
Relative to other workers, most survey respondents earned between $16-$20 below the average hourly wage of U.S. employees on private, nonfarm payrolls, at $35 [3].
Workload
Domestic worker respondents also reported fewer working hours in the second quarter of 2025. Eighteen percent of respondents worked 31 hours or more per week on average, compared to 21% in the first quarter of 2025. At the same time, we saw a 2 percentage point increase in the share of respondents who reported working 1 to 20 hours per week.
Eighteen percent of respondents reported no work altogether, a slight increase from the previous quarter. When asked about their workload, 63% of respondents said they wanted more work hours, an increase from 61% in the previous quarter. Reasons for underemployment included:
Did not find new clients (65%)
Health problems (13%)
Caring for family members (11%)
Other (11%)
Job Quality
Written Contracts
Only 6% of domestic workers surveyed had a written contract that includes paid time off. In the second quarter of 2025, 17% of domestic worker respondents said they had a written contract with at least one of their employers. Among those respondents, 38% said their contract included paid time off for vacation or sick leave.
Sick Leave
More than half of surveyed domestic workers felt very or somewhat uncomfortable asking for a sick day. A plurality of domestic worker respondents (36%) said they would feel “somewhat uncomfortable” asking for a day off if they felt sick or had to care for a family member. Sixteen percent said they would feel “very uncomfortable”.
Conversely, 28% of respondents in the second quarter of 2025 reported they would feel “somewhat comfortable”, followed by 19% feeling “very comfortable”, requesting a sick day.
Despite reported discomfort, half of the workers surveyed said they had asked their employer for a sick day. In the three months preceding the survey, 50% of domestic worker respondents requested sick leave from an employer. For respondents who requested time off, 90% of employers granted the day off, but only 21% of those paid for the sick day.

Work Breaks
One in three workers reported taking regular meal or rest breaks during their work day. When asked how often they took breaks at work for meals or rest in the preceding two weeks, only 34% of respondents reported “regularly” taking breaks. Forty-one percent said they took breaks “sometimes”, followed by 18% who responded “almost never” and 8% said they “never” took breaks [4].
Working Environment
Over 8 in 10 domestic worker respondents reported regular (40%) or occasional (43%) health and safety concerns at work. When asked if they experienced health or safety concerns while working during the previous three months, 40% of domestic worker respondents said they “regularly” felt concerned. A plurality of respondents (43%) reported feeling concerned for their health or safety “sometimes”, followed by “almost never” among 13% and “never” among 5% of respondents.

About one-third of domestic worker respondents (33%) said they were treated unjustly or disrespectfully at work either sometimes (24%) or regularly (9%). Meanwhile, 66% of respondents said they never (29%) or almost never (37%) experienced unjust or disrespectful treatment in the three months preceding the survey.
Psychological Well-Being
More than half of domestic worker respondents (51%) reported poor psychological well-being in the second quarter of 2025, according to the well-being score threshold suggested by the WHO2. While this is a slight improvement compared to the first quarter of this year (53%), it is significantly higher than the 43% of respondents with poor psychological well-being reported in the spring of 2024.
The WHO suggests that individuals with poor psychological well-being warrant further assessment for a possible mental health condition, including depression. For more information on survey methods and findings, please read our latest well-being report.
Worker Voice
Building on prior worker voice research for domestic workers, in the second quarter of 2025, respondents were asked about their voice gap: the difference between how much voice domestic workers believe they ought to have and how much voice they actually have. This measure of domestic worker voice gap will be reported yearly to track changes over time.
Surveyed domestic workers were asked about their voice at work regarding wages, working conditions, being treated with respect, resolving disagreements, and deciding how to perform their work. House cleaners were asked an additional question about voice when deciding which cleaning products to use, while nannies and homecare workers were asked about voice when deciding the care and activities their clients need.
Similarly to last year, domestic worker respondents reported having less say than they believe they ought to have in almost all workplace issues, with wages and working conditions having the largest voice gaps.
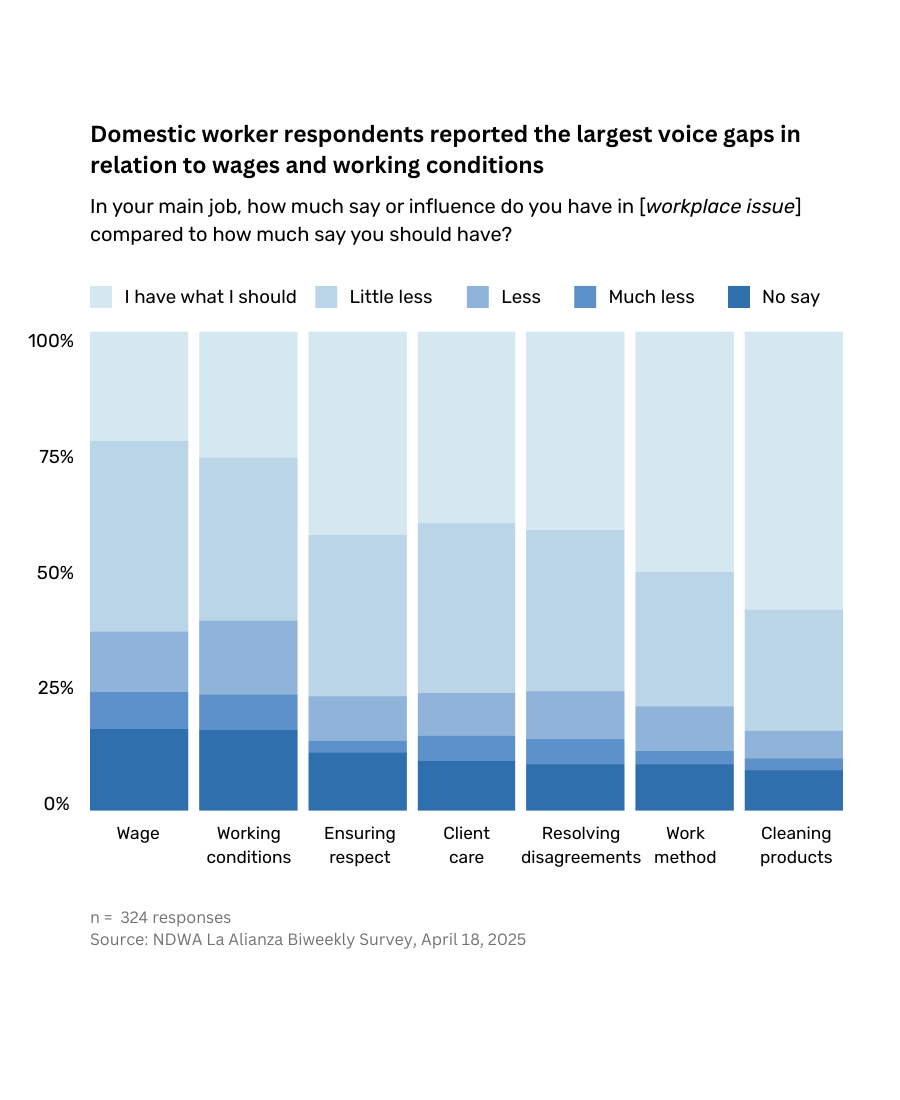
In the second quarter of 2025, the mean voice gap across all workplace issues was unchanged compared to 2024 [5]. Domestic workers reported a mean voice gap of 2.2 across all workplace issues. Using a scale of 1 (I have what I ought to have) to 5 (no say), this average represents between a “little less” and “less” say than they believe they ought to have. House cleaners reported lower voice gaps overall compared to home care workers.
ABOUT THE SURVEY
NDWA surveys thousands of Spanish-speaking domestic workers via La Alianza, a Messenger chatbot. The survey is sent every other week excluding office closures. This report includes data from seven biweekly surveys in the second quarter of 2025. The total number of fully completed surveys, which includes both new and repeated respondents, was 2,889.
Questions about workers’ employment situation are asked biweekly, questions regarding economic security are asked monthly, and questions regarding both job quality and well-being are asked quarterly. Questions regarding worker voice are asked yearly.
To learn more about NDWA’s La Alianza survey of Spanish-speaking domestic workers, this methodology report.
References
1 Economic Policy Institute (2022), Domestic Workers Chartbook
2 World Health Organization (2024), The World Health Organization-Five Well-Being Index (WHO-5)
3 U.S. Bureau of Labor Statistics (2025), Table B-3. Average hourly and weekly earnings of all employees on private nonfarm payrolls by industry sector, seasonally adjusted
4 Percentages are rounded to the nearest whole number and may not total 100% due to rounding
5 National Domestic Workers Alliance (2024), Worker Voice in Private Homes: Measuring Domestic Workers’ Say in Workplace Issues